How much cheaper are EVs, really? With fleet costs in mind, Martin Henare, our Electric Vehicle Infrastructure Lead, does a deep dive during a work trip.
I needed to travel from Melbourne to client company East Gippsland Water recently, a round trip of 700km over three days. I took my 2019 Tesla Model 3 SR+ and some notes, as I wanted to compare the costs had I driven the company’s 2015 diesel VW Amarok or one of a range of other internal combustion engine (ICE) vehicles.
The route included a mix of roads, including suburban, freeway, open rural, hilly rural and rural towns. The round trip for me would be 700km, but my Tesla does about 320km on one charge; most newer EVs have longer ranges than this. So, you may be thinking: Was I suffering from range anxiety?
Well, no. Any trip, whether in an ICE car or not, needs a little planning. In fact, EVs with in-built navigation can plan an entire trip, including charging locations and durations. A range of phone apps provide similar tools.
At home, I’m able to charge for free during certain times of the day; various electricity retailers offer EV-friendly tariffs. Off-peak times cost just 22 cents per kilowatt-hour. For this trip, my overnight charges cost $2.61 and I left with a full battery.
The first leg of my trip was 176km and took me to Korumburra and Leongatha, using just over half of the battery charge. My final destination, Bairnsdale, was a further 190km, but I didn’t have enough charge to the get me there. So, the next stop was the Tesla Supercharger at Traralgon, 72km away. I got there with 13%, needing 49% to get to Bairnsdale. For technical reasons, little-and-often charging is faster; charging to 49% took nine minutes and cost $8.96.
From Bairnsdale to my motel was 118km, and I got there with 12% left in the battery. With dinner in mind, I charged at the Bairnsdale Tesla Supercharger. After 20 minutes and a pizza, the charge had reached 69% – good enough! The cost was $14.17. My pizza cost more than that.
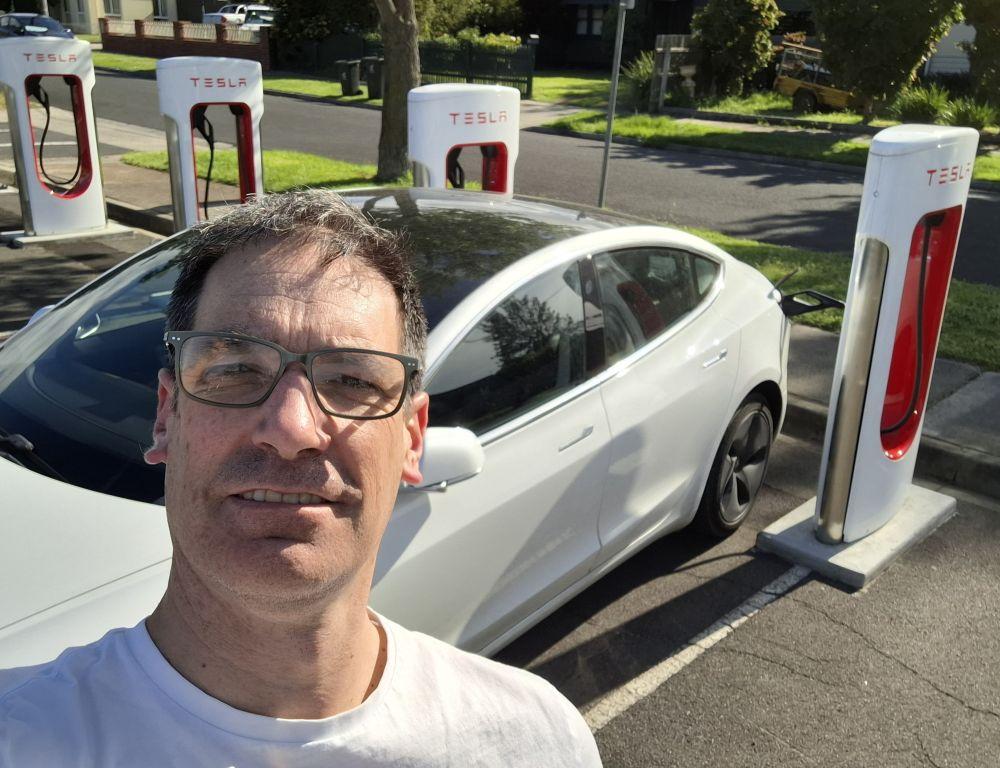 The next day I was in someone else’s car, but the distance we covered would have easily fallen within the 69% in the Tesla. After another overnight stay, and with the Tesla at 67%, it was time to cover the 318km home. I arrived at Traralgon again with 5%. I needed 83% to take me the final 198kms home. That took 30 mins at a cost of $18.66 while I wandered off to a nearby market. I arrived home after three and half hours of driving with 17% left.
By the numbers
All Teslas have extensive data-logging and it’s easy to download the data. So, here’s the numbers:
- 696km over two days
- 119 kWh energy consumed
- Three charging stops over 59 mins, which included 39 mins while on the road
- Charging cost $44.41 (including home charging) or 6.4c/km
So, what if I had taken the Amarok?
Using combined fuel figures from the Green Vehicle Guide (derived from laboratory testing in controlled conditions), it would have consumed 59l of diesel costing $105.89. That adds up to 15c/km, or 58% more expensive than the Tesla.
The Amarok is 10 years old, so let’s compare against the most popular vehicles on Australian roads for the same trip. The fuel consumption numbers are from the Real-World Testing Program run by the Australian Automobile Association.
| Vehicle | Fuel type | l/100km | Fuel needed (l) | Trip cost ($)* | Cost (c/km) | Diff ($) | Diff % |
| 2019 Tesla Model 3 | Electric | N/A | N/A | 44.41 | 6.4 | ||
| 2023 Toyota Corolla Hybrid | 91 RON | 4.2 | 29 | 53.45 | 7.7 | 9.04 | 17% |
| 2022 Toyota RAV4 Hybrid | 91 RON | 4.8 | 33 | 61.09 | 8.8 | 16.68 | 27% |
| 2023 Hyundai i30 | 91 RON | 7.5 | 52 | 95.45 | 13.7 | 51.04 | 53% |
| 2023 Mitsubishi Outlander | 91 RON | 7.9 | 55 | 100.54 | 14.4 | 56.13 | 56% |
| 2024 Mazda CX-5 | 91 RON | 9 | 63 | 114.54 | 16.4 | 70.13 | 61% |
| 2023 Toyota Hilux 2.8L | Diesel | 7.9 | 55 | 98.41 | 14.1 | 54.00 | 55% |
| 2024 Isuzu D-Max 4×4 | Diesel | 8.5 | 59 | 105.89 | 15.2 | 61.48 | 58% |
| 2025 Ford Ranger | Diesel | 8.9 | 62 | 110.87 | 15.9 | 66.46 | 60% |
| 2025 Ford Ranger | 91 RON | 12.3 | 86 | 156.53 | 22.5 | 112.12 | 72% |
* Fuel prices as of 23/10/25 at the nearest petrol station to point of departure
Overall, the EV was 17% cheaper than the Toyota Corolla hybrid, 58% cheaper than the Amarok, and over 70% cheaper than the petrol Ranger. The majority of non-EVs would have been more than twice as expensive to run on this trip.
Most EV charging in Australia is done at home on AC charging at less than 22c/kWh, and a high percentage of these homes, like ours, has solar. My actual charging cost for the Tesla for the last 12 months has been $215.32 or 2.2c/km over 9706 km, which has covered the majority of my driving. My annual average mileage since ownership is higher at 14,417km.
We see the financial benefit of EVs over ICE vehicles if we take an assumed 14,000km using the figures at the Real-World Testing Program and compare them to my real-world c/km charging costs for the year. The fuel costs were the annual average for Victoria at $1.84 for both 91 petrol and diesel.
| Vehicle | Fuel Type | l/100km (comb) | Fuel needed (l) | Annual cost ($) | Cost (c/km) | EV savings ($) | EV % saving |
| 2019 Tesla | Electric | N/A | N/A | 330 | 2.2 | ||
| 2023 Toyota Corolla Hybrid | 91 RON | 4.2 | 588 | 1081.92 | 7.7 | 751.92 | 69% |
| 2022 Toyota RAV4 Hybrid | 91 RON | 4.8 | 672 | 1236.48 | 8.8 | 906.48 | 73% |
| 2023 Hyundai i30 | 91 RON | 7.5 | 1050 | 1932.00 | 13.8 | 1602.00 | 83% |
| 2023 Mitsubishi Outlander | 91 RON | 7.9 | 1106 | 2035.04 | 14.5 | 1705.04 | 84% |
| 2024 Mazda CX-5 | 91 RON | 9 | 1260 | 2318.40 | 16.6 | 1988.40 | 86% |
| 2023 Toyota Hilux 2.8L | Diesel | 7.9 | 1106 | 2035.04 | 14.5 | 1705.04 | 84% |
| 2024 Isuzu D-Max 4×4 | Diesel | 8.5 | 1190 | 2189.60 | 15.6 | 1859.60 | 85% |
| 2025 Ford Ranger | Diesel | 8.9 | 1246 | 2292.64 | 16.4 | 1962.64 | 86% |
| 2025 Ford Ranger | 91 RON | 12.3 | 1722 | 3168.48 | 22.6 | 2838.48 | 90% |
Using these real-world figures puts annual savings from going electric at over 80% for the majority of the cars. The Tesla was 70% cheaper than the two hybrids. The 2025 petrol Ford Ranger was a whopping 90% more expensive.
On average, a business going electric could see 70-90% savings on transport operating costs. And these savings don’t include the reduced maintenance cost of EVs.
Counting emissions
Let’s talk emissions, as this trip was also about sustainability. The Amarok would have emitted an estimated 142 kg CO2e, according to the lab-derived figures at the Real-World Testing Program. We have real-world figures on carbon emissions for the following ICE vehicles:
Comparison to ICE vehicles (same trip, tailpipe CO2e only)
| Vehicle | Fuel Type | l/100km (comb) | Fuel needed (l) | Tailpipe CO₂ (g/km)# | kg CO2e | Difference |
| Tesla | Electric | N/A | N/A | 78.2* | 55 | |
| 2023 Toyota Corolla Hybrid | 91 RON | 4.2 | 29 | 99 | 69 | 20% |
| 2022 Toyota RAV4 Hybrid | 91 RON | 4.8 | 33 | 111 | 77 | 29% |
| 2023 Hyundai i30 | 91 RON | 7.5 | 52 | 173 | 121 | 54% |
| 2023 Mitsubishi Outlander | 91 RON | 7.9 | 55 | 183 | 128 | 57% |
| 2024 Mazda CX-5 | 91 RON | 9 | 63 | 205 | 143 | 62% |
| 2023 Toyota Hilux 2.8L | Diesel | 7.9 | 55 | 208 | 145 | 62% |
| 2024 Isuzu D-Max 4×4 | Diesel | 8.5 | 59 | 223 | 155 | 65% |
| 2025 Ford Ranger | Diesel | 8.9 | 62 | 236 | 165 | 67% |
| 2025 Ford Ranger | 91 RON | 12.3 | 86 | 286 | 199 | 72% |
* EV emissions were estimated based on the Victorian fuel mix at the specific times of charging as reported by OpenNEM and AEMO. A value of 0.591 kg CO2e/kWh was used.
# Combined fuel figure and measured carbon emission from www.realworld.org.au
Carbon emissions for EVs fluctuate depending on the energy mix going into the grid from which they draw. In Victoria, that can vary between 40-90 CO2e(kg). In the table above, the emissions calculations were based on the energy mix in the Victorian grid at the times the car was charging. All ICE vehicles would have produced higher emissions, with the non-hybrids all more than 50% higher.
Victoria’s current Scope 2 factor for electricity emissions (emissions caused indirectly) is currently set at 0.77 kg CO2e/kWh for 2024. Using this measurement, the RAV4 has equal emissions to the Tesla and the Corolla 20% less.
Currently, the Victorian grid is still dependent on brown coal, placing the EV and hybrids very evenly on emissions, depending on the time of day you charge. As hybrid cars rely 100% on petrol, their emissions can’t be improved. However, with EVs, as the grid energy mix changes, emission calculations change, and with the swing to renewables, emissions are becoming lower over time. Actual emissions can be reduced simply by charging when renewables are generating at their peak.
So having come home from my trip, what’s my key message? If your home or business has solar already, the emission equation swings quickly and strongly toward EVs, offering you benefits on both a cost and climate basis.
Keen to explore taking your fleet electric? Email me at martin.henare@middletongroup.com.au
Sources:
Australian Bureau of Statistics
Internal combustion fuel consumption and emission value were sourced from the Real-World Testing Program and the Green Vehicle Guide using the combined efficiency values.
The Tesla data is provided by the author’s vehicle trip computer, efficiency display and Teslify vehicle data monitoring software.
Petrol and diesel prices used were prices at the nearest petrol station from the author’s house, the Ampol, Melton Highway, Hillside, Victoria on October 23, 2025.
Electricity emissions sourced from AEMO, energy.gov.vic.au and energy.gov.au.
Electricity tariffs from Powershop EV Day and EV Night plans.